Expanding Globally: How Do You Decide Where To Go, part 3
In the previous blog post, I discussed how legal and financial similarities and differences could be helpful in making your decision about where to expand to first and shared some resources for comparing countries.

on Unsplash
In this blog, we will continue to discuss ‘How Do You Decide Where to Go First?’ but from the point of the market size and related factors. I suggest that the followings are useful qualification criteria:
• Gross Domestic Product (GDP) Rank
• Market Growth (GDP Growth Projections)
• Total Research & Development (R &D) expenditure
• Relevant products (e.g. Pharmaceutical/Life Science related products) imports
• Numbers of Researchers
• Innovativeness
GDP Rank (Market Size)
Gross Domestic Product (GDP) is the value of a country’s goods and services in a specific period. GDP is a critical measurement of an economy’s size, performance, domestic production and a country’s economic health. Checking GDP is important because our businesses are impacted by the strength of global and local economies.
Therefore, when an organization or a company is looking to expand into new markets, we might use GDP to evaluate which markets are strongest. Depending on your products, you might want to review the top 10 or 50 countries, to begin with.
Let’s see how we can find the market size (GDP rank). We can easily find it on Google or any search engine. Here are some helpful links:
• World Bank GDP
• Investopedia – The Top 25 Economies in the World
• International Monetary Fund (IMF)
Here is an example of GDP ranked by country from 2022.
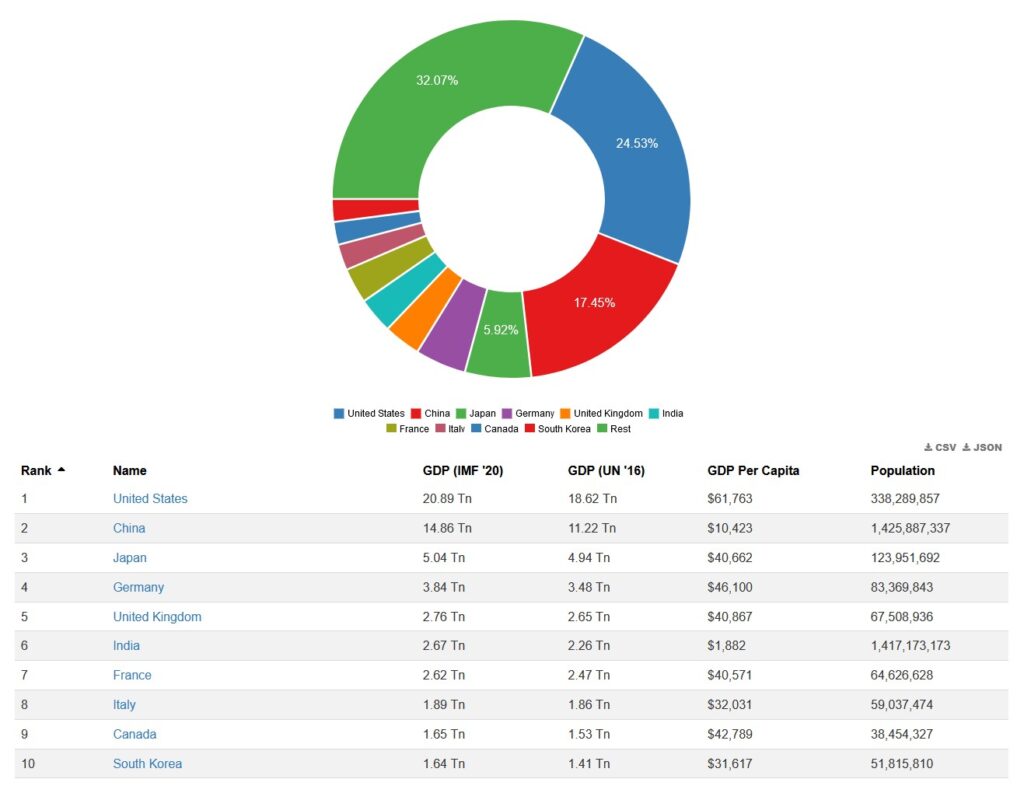
You can find the full report on World Economic Outlook from IMF.
Market Growth (GDP Growth Projections)
As important as GDP is, GDP growth projections shouldn’t be ignored as we can see the market’s future growth.
Many organisations provide market growth, so you can easily find the data by Googling. Here is PWC’s report for an example.
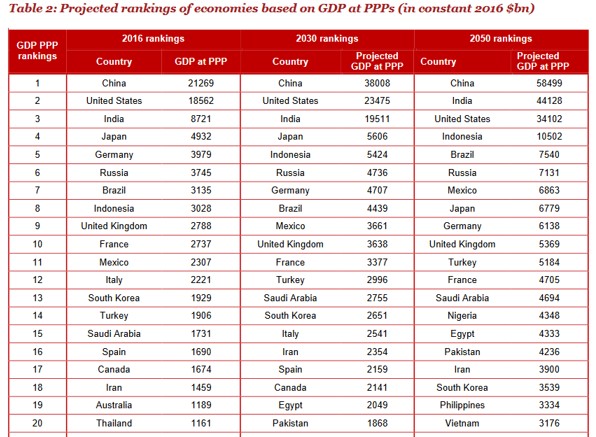
It’s generally a good sign for business when GDP is growing, but you also need to understand other factors related to the growth. For example, a country’s GDP might not be growing as fast as its population, i.e. GDP per capita isn’t rising, which means the people’s standard of living and purchasing power isn’t increasing, so it is not a good sign.
Total R & D expenditure
Knowing a country’s total R & D expenditure is crucial as we can see the country’s future and how funding research can boost the country’s economic competitiveness. It’s also vital to national economies and plays an important role in GDP growth. This is even more crucial for the Biotech industry as government funding affects our market significantly.
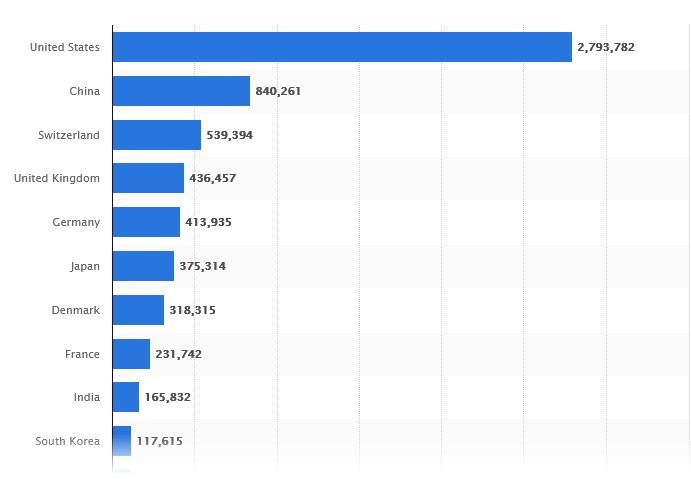
According to Statista Research, the top five are the United States, China, Japan, Germany and South Korea, as you can see from the following bar chart. (Published by Statista Research Department, Aug 5, 2022). Note that Statista Research updates the data every year as it changes.
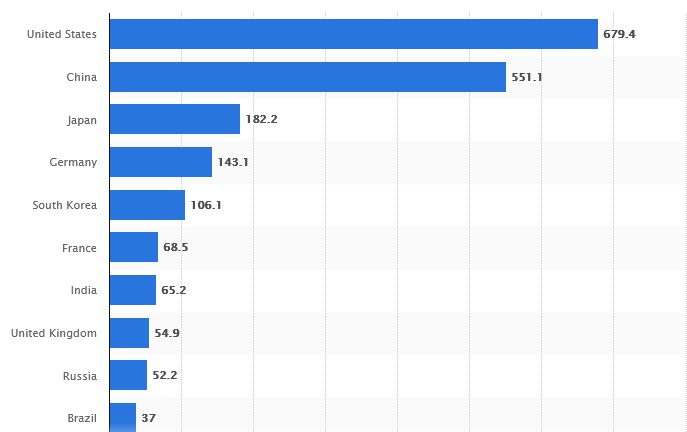
(in billion U.S. dollars) Published by Statista Research Department, Aug 5, 2022
Pharmaceutical R & D expenditure
As our industry is Pharmaceutical related, it will be good to review R & D expenditure just in this area. If the value is higher than others, you have a big pool to play in.
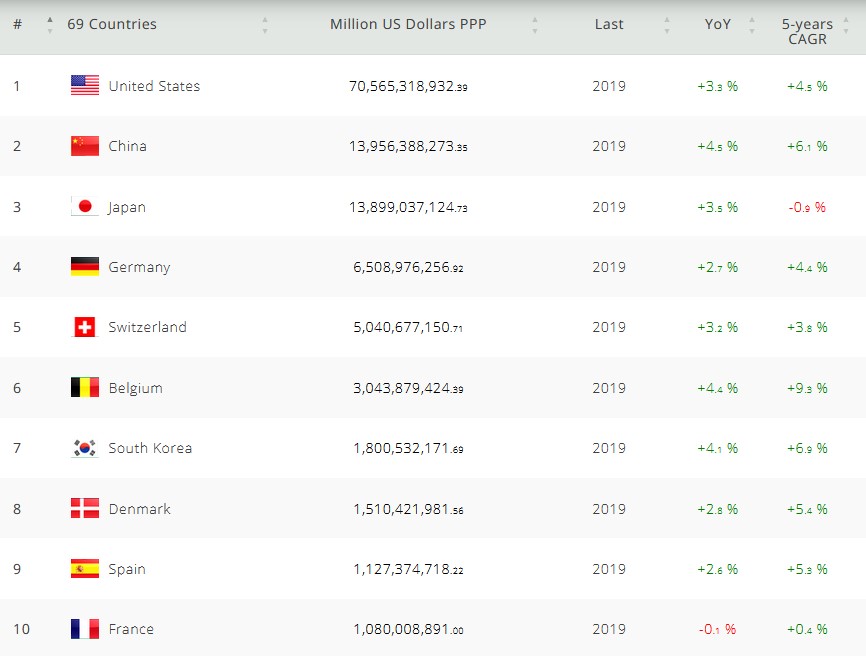
(Million US Dollars PPP – 1987 to 2019)
Note how looking back at the total R & D, US and China have similar expenditures however the Us spends much more on Pharmaceutical R & D alone, so if you don’t look at the sector-level expenditure, you will misjudge the market. In addition, if you look at the countries that rank 2 to 5 in total expenditure, you’ll see some other differences: it shows that compared to the US, China, Japan, Germany, and South Korea are investing in other sectors more than the Pharmaceutical sector. You can also see that Switzerland and Belgium come above South Korea, and the UK could not be ranked within the Top 10 here. In the case of Switzerland, we know that it has many global Pharmaceutical companies, so the expenditure is higher than others.
Value of the pharmaceutical sector worldwide
You can also check the total value of the Pharmaceutical sector by country. You can see from the graph below that the US have more than double the amount of value of the Pharmaceutical sector than the total of the next 4.
Imports of relevant products (e.g. Pharmaceutical/Life Science related products)
It is very important to know how much each country imports products relevant to yours because you can then estimate the Total Addressable Market (TAM) size and competition in a country.
Global Trade Magazine reported, “In 2020, Germany’s composite laboratory reagent imports peaked at $3.8B, steadily growing with an average annual rate of +3.8% over the past decade. The U.S., South Korea and the U.K. constitute the largest supplying countries in value terms. South Korea emerged as the fastest-growing supplier in 2020, ramping up the shipments to Germany by +56% y-o-y.” (Global Trade Magazine, February 4th, 2022).
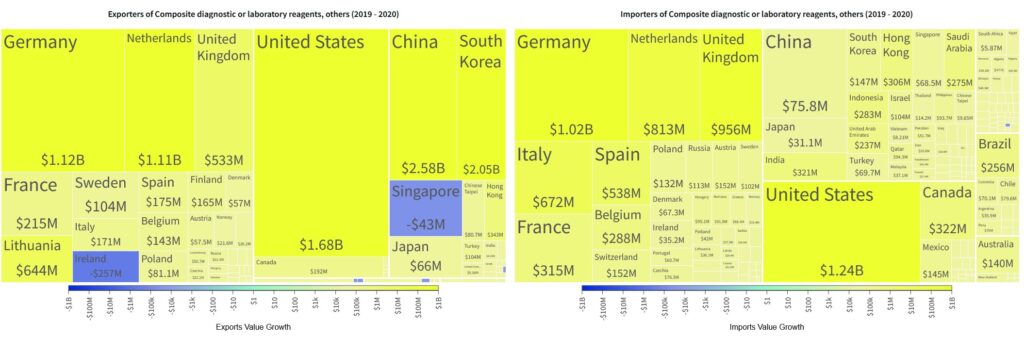
You can find imports and exports data from the OEC World website with a summary of each category of exports and imports as in the image below. https://oec.world/en/profile/hs/laboratory-reagents
The OEC World has reported that a total value of $40B of Laboratory Reagents was traded in 2020. Between 2019 and 2020, the exports of Laboratory Reagents grew by 42.3%, from $28.1B to $40B.
Exports: In 2020, the top exporters of Laboratory Reagents were the United States ($9.65B), Germany ($5.55B), China ($3.21B), Netherlands ($3.15B), and the United Kingdom ($2.62B).
Imports: In 2020, the top importers of Laboratory Reagents were the United States ($5B), Germany ($4.01B), the Netherlands ($2.55B), China ($2.36B), and the United Kingdom ($2.19B).
")
Note that there were dynamic changes in the market between 2019 to 2020.
In this period, the exports of Composite diagnostic or laboratory reagents others grew the fastest in China ($2.58B), South Korea ($2.05B), the United States ($1.68B), Germany ($1.12B), and Netherlands ($1.11B).
And the same period, the fastest-growing importers of Composite diagnostic or laboratory reagents, others were the United States ($1.24B), Germany ($1.02B), the United Kingdom ($956M), the Netherlands ($813M), and Italy ($672M).
You can find the latest trade data on the “Composite diagnostic or laboratory reagents, others” page here.
You can also find similar annual International Trade statistics by countries from the TrendEconomy.
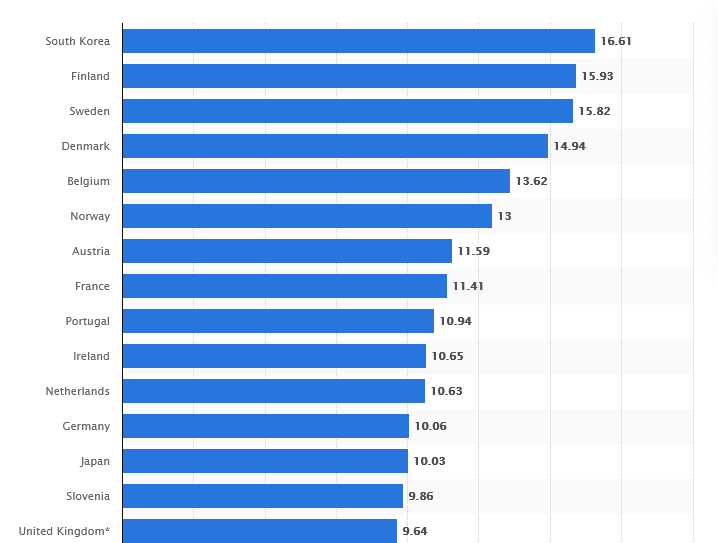
Numbers of Researchers
If you know the number of researchers in a country, you can see how easy it could be to hire researchers. It also indicates whether the government supports that sector by educating and training researchers.
I found “The Global Talent Competitiveness Index 2021 Report” from Insead:
Further information on the Number of Life Scientists:
· UK: Bioscience and health technology sector statistics 2020
Additionally, you may want to check the following information depending on what you would like to achieve:
-
- Population
- Research spending
- Number of publications or growth of publications
- Number of Life Science cluster
If you are producing drugs for specific patients, you will need to find how many patients and the growth rates in the country as well.
It is also interesting to look at the innovativeness of countries as it shows how dynamic nations are. I found the following two links are useful:
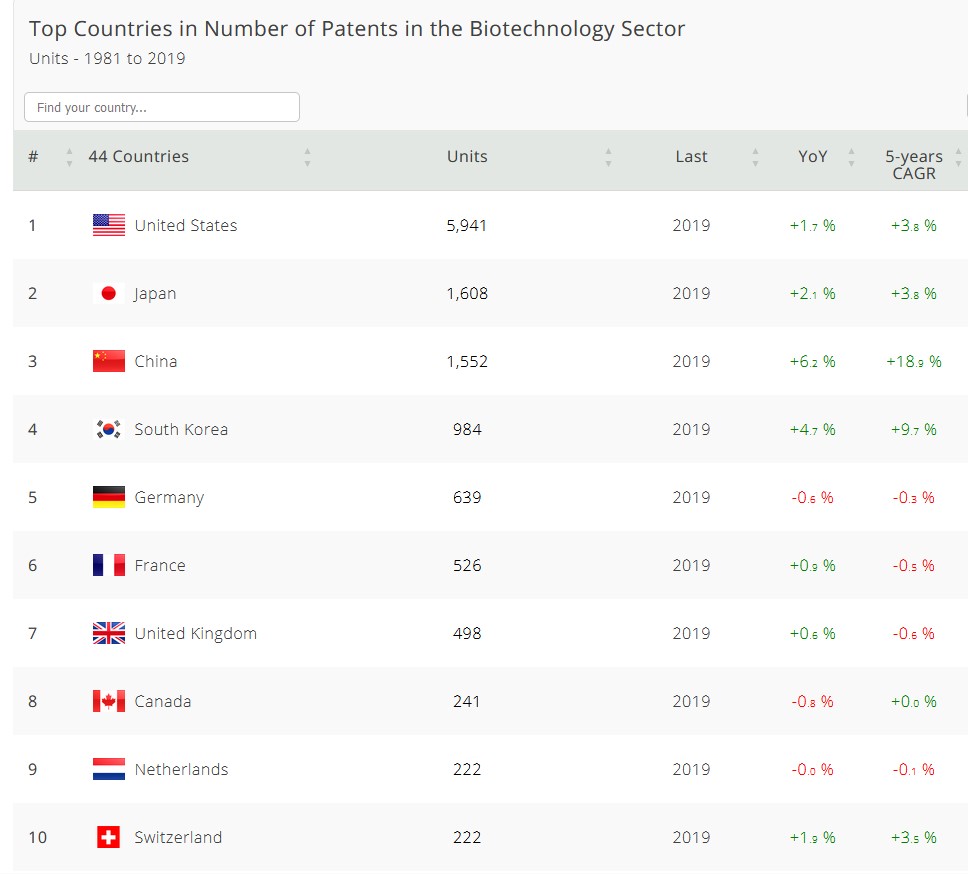
In addition to the information we have been looking for, you can also check out how many Patents the country has and the growth rates, as Intellectual property (IP) contributes significantly to both national and companies economies. Many different sectors and industries rely on regulation, including the appropriate prosecution of patents, trademarks, copyrights, and trade secrets. This is not different in the Biotechnology Sector, and maybe more encouraged to do so as it took longer to develop drugs and treatments than in other industries. You can see which countries invest more money and resources by checking the rates of how many IPs are filed.
The following table shows the top Countries in the Number of Patents in the Biotechnology Sector.
You can find more patents data from the following websites:
-
- IP Facts and Figures – https://www.wipo.int/edocs/infogdocs/en/ipfactsandfigures/
-
- Statistics & Trends Centre | Epo.org – https://new.epo.org/en/statistics-centre
Summary
In this post, I highlighted a number of important market-size-related criteria to consider when choosing a country to expand to. Next time I’ll show how to bring together all the information discussed so far in this blog series and how to come to a decision.
#Biotech #Lifesciences #Global #Scaleup #Startup #Cambridgebiosolutions Biotech consulting Expanding Globally LifeScience Scaleup